Utilization
The Utilization Report provides a summary of all volume and costs for tests ordered by an administrator's institution. The Utilization Report can be generated to capture volume for the entire institution, or can be prepared to capture volume for a single laboratory only.
The Utilization Report displays selected data in two ways, in graphical form on top and in a data table below the graph.
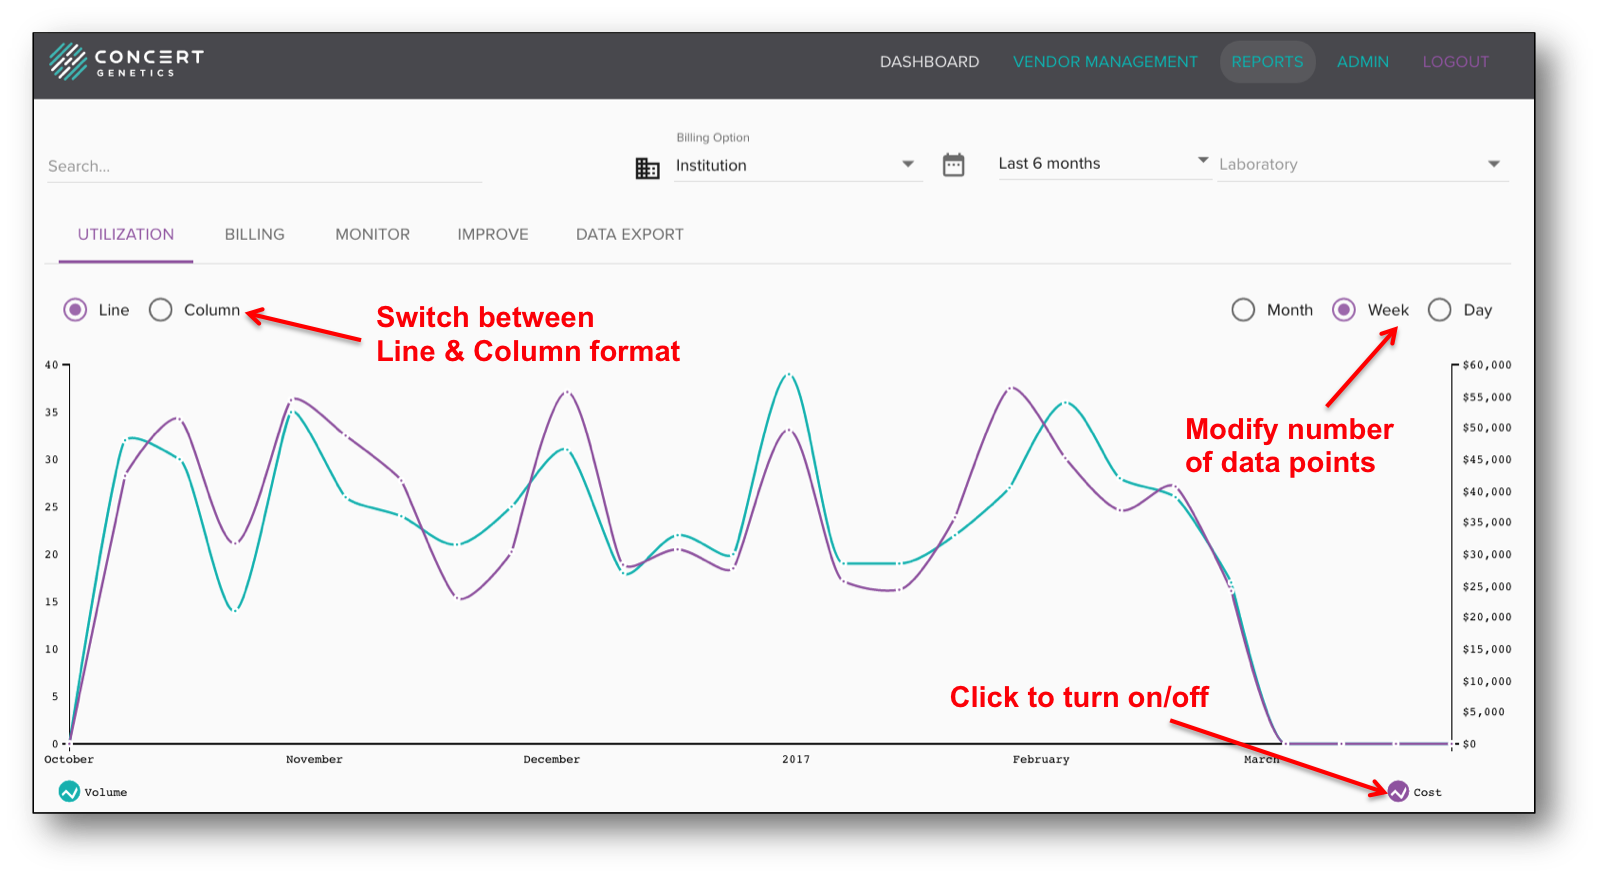
Within the Utilization graph, there are several features that can be accessed to customize it:
- Switch between Line and Column
- Switch between Days/Weeks/Months
- Show Volume and Cost together or separate
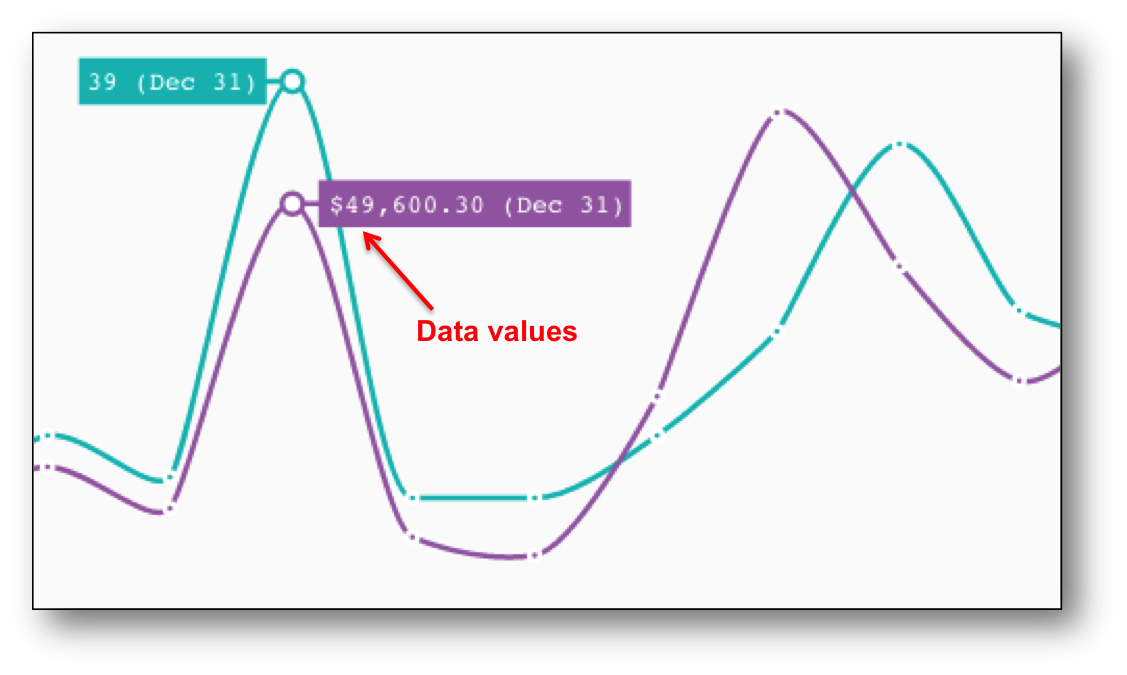
Once the administrator has modified the preferred number of data points, he/she can access those data points by moving the cursor over the selected data point. The number represents the value and the date represents the first day/month that time period represents. For example, in the image below, that data point represents a period that began on December 31.
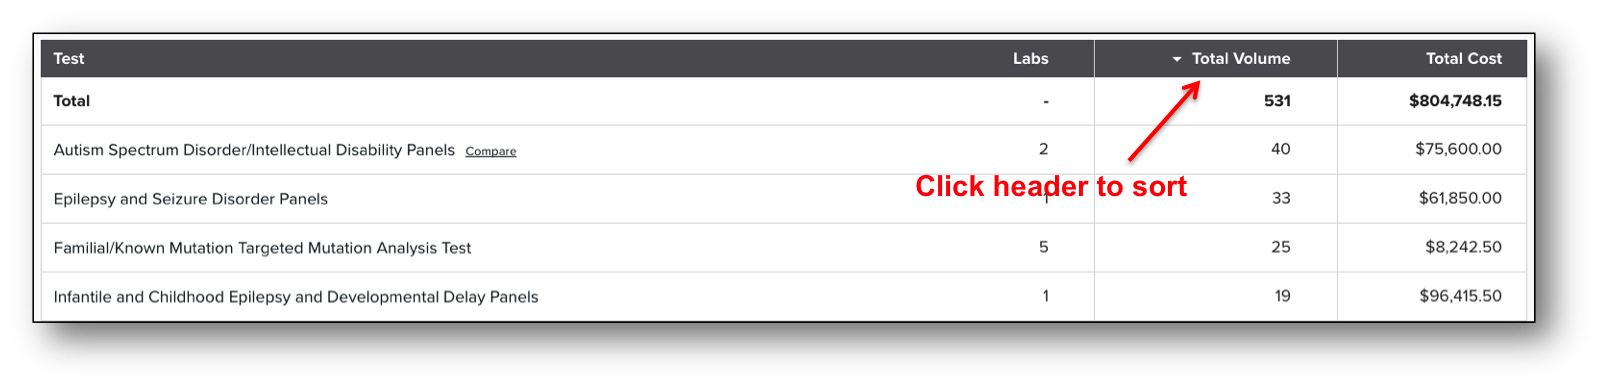
Within the Utilization table, an administrator will find a list of all tests that have been ordered by his/her institution. Tests have been categorized to simplify utilization management and comparison. Each test category in the table include: the number of labs, the total volume, and the total cost.
You can sort the data by Total Volume and Total Cost by clicking on the preferred header.